

PublicationComponent Tab
This tab only appears when you select an existing analytic component that has been inserted into the publication. The ribbon changes depending on the type of component selected.
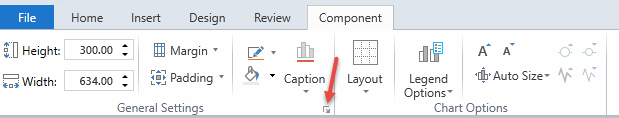
General Settings
Height/Width: You can adjust the height and width of the component.
Margin: You can adjust the margins between the component and the surrounding text. Select the More Margin Options to customize the margins.
Padding: You can adjust the spacing between the component and the component outline. Select the More Padding Options to customize the padding.
Border Color: You can alter the component outline by giving it colors etc.
Background Color: You can adjust the background of the component outline.
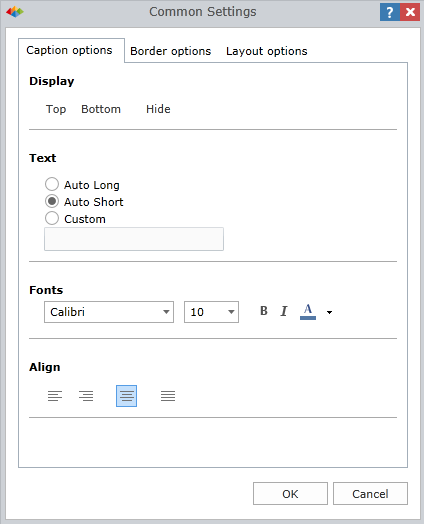
Caption: You can select where the caption will be located, if at all. Select more options to further customize the caption using the bottom part of the split button.
Advanced Dialog
You can click on this icon (as indicated by the red arrow) to display all the setting options in one pop-up box. You can toggle between the tabs to make adjustments.
Component Type Settings
Grid Components
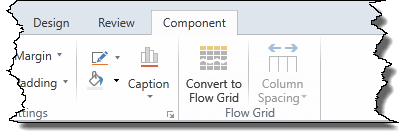
Convert/Revert to Flow Grid – this function allows you to insert a large-scale grid, which is likely too large for one page, and let it flow from one page to multiple pages. For more information on the Flow Grid, click here.
Column Spacing – You can adjust the column size.
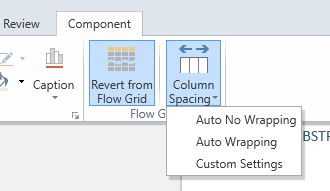
- You can select Auto Wrapping to auto adjust the size of the grid in comparison to the component outline.
- You can select Custom Settings to customize the column width.
Chart Components
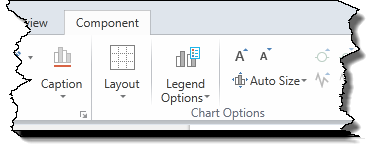
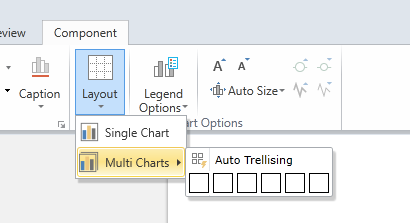
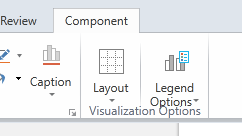
Layout – You can separate a chart that contains a few elements into separate charts with the multi chart option. You also alter the layout of the chart by selecting rows and columns (see below image).
Legend Options – You can determine the position of the legend within the component layout , or choose to hide it altogether.
Chart options for scalability – You can adjust the axis scale and the font size of the chart.
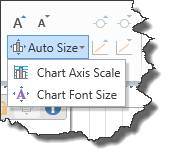
- First, you need to select the Chart Axis Scale or Chart Font Size in the Auto Size drop–down menu (see above image).
- Then, you can increase or decrease size with the big and little “A”s.
Gauge Components
Increase and Decrease Font Size Icons – You can adjust the font size of the displayed text
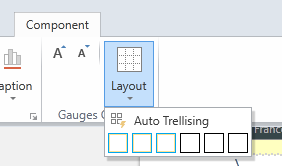
Layout – You can separate a gauge that contains a few elements into separate gauges. You also alter the layout of the gauges by selecting rows and columns (see below image).
Advanced Visual Components
Layout – You can separate a gauge that contains a few elements into separate gauges. You also alter the layout of the gauges by selecting rows and columns (see below image).
Legend Options – You can determine the position of the legend within the component layout , or choose to hide it altogether.
Mapping Components
There are no added component options.
Home |
Table of Contents |
Index |
User Community
Pyramid Analytics © 2011-2022